
Quick Takes
● Risk take off again. Equities warmed up as the weather cooled off. Risk assets were buoyed by the start of a strong earnings season, the S&P 500 had its best month since November of 2020 and most indices were in the green for October.
● Yields rise with equities. The FOMC meeting for October brought us one step closer to the tapering of assets and possibly accelerated the timeline for an interest rate hike. The yield on the 10-year rose a modest 6bps for the month, but the yield on the 2-year treasury spiked 22bps.
● Rollercoaster ride for the Dollar. The greenback had a volatile month for October. It spent the beginning of the month in a steady upward direction, before falling, and finally recovering on the last trading day of the month, ending slightly higher than where it started.
● Supply chains, Labor Markets, and Inflation. Supply chain bottlenecks, labor market constraints, and high inflation continue to weigh on economic growth. Company executives continue to site these issues on earnings call as the biggest headwinds to progress.
Asset Class Performance
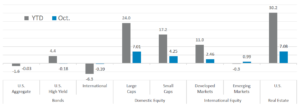
Risk assets were able to recover September’s losses and add to their already stellar YTD gains. The S&P 500 and Nasdaq finished the month at new highs. U.S. Real Estate claimed the crown for the month at +7.08%.
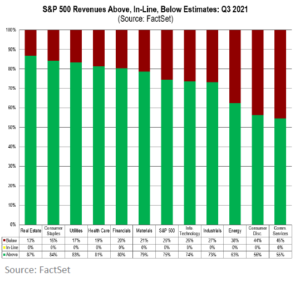
Stocks achieve record highs on strong earnings season
After September’s gruesome month for equities, indices were able to reclaim their losses and climb to new highs on the back of a fantastic start to the Q3 earnings season. In the chart below, Factset reports that 75% of S&P 500 companies have beat revenue estimates, which is well above the 5-year average of 67%. Despite increased cost pressure from supply chain disruptions, labor market constraints, and high inflation, S&P 500 companies are reporting year-over-year earnings growth of 36.6%, the largest increase since Q2 of 2010 and the 3rd largest increase since FactSet began tracking data. With earnings acting as giant tailwind for equities, market participants were able to shake off a miss in GDP numbers, +2.0% versus expectations of +2.6%. The S&P 500 rose +6.91% for the month of October, but the Nasdaq was able to best it, up +7.27% for the month. Small Caps were more muted, but the Russell 2000 was still able to post a solid month, up +4.21%. International equities didn’t fair quite as well as domestic equities for the month of October, the STOXX Europe 600 index was up +4.55% and the Nikkei-225 was down -1.90%.
While equities were able to shrug off the disappointing economic growth numbers last month, overall, economic data releases relative to consensus estimates have been in negative territory. As the chart below illustrates, the U.S. Citi Economic Surprise Index, a measure of all economic data releases versus their consensus estimates, appears to have bottomed out and recovered slightly, but remains below zero. Market participants are hopeful that continued progress on vaccinations, and thus a decline in Covid-19 cases, could spur consumers to return to spending in the fourth quarter of the year. Estimates for economic growth remain lofty for the last quarter of the year and the Fed is expected to announce a timeline to the tapering of asset purchases in November.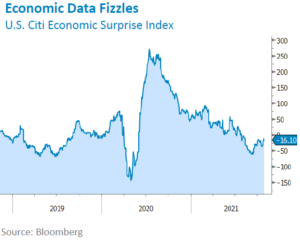
With the Fed tightening monetary policy, employment constraints, and continued supply chain difficulties, risk assets’ tailwinds are starting to diminish. consumers and corporations are still in excellent financial condition, so while tailwinds are moderating, they have not disappeared entirely.
Bottom Line: Equities resumed their theme of setting new highs on the back of strong earnings and despite softer than expected economic growth for the month. While inflation, employment, supply chain disruptions, and the Fed tightening monetary policy all represent potential headwinds, these risks are known and likely already priced in. The path of least resistance for risk assets remains upward, but likely at slower pace and with more bouts of volatility.
Click here to see the full review.
—
©2021 Prime Capital Investment Advisors, LLC. The views and information contained herein are (1) for informational purposes only, (2) are not to be taken as a recommendation to buy or sell any investment, and (3) should not be construed or acted upon as individualized investment advice. The information contained herein was obtained from sources we believe to be reliable but is not guaranteed as to its accuracy or completeness. Investing involves risk. Investors should be prepared to bear loss, including total loss of principal. Diversification does not guarantee investment returns and does not eliminate the risk of loss. Past performance is no guarantee of comparable future results.
Source: Bloomberg. Asset‐class performance is presented by using market returns from an exchange‐traded fund (ETF) proxy that best represents its respective broad asset class. Returns shown are net of fund fees for and do not necessarily represent performance of specific mutual funds and/or exchange‐traded funds recommended by the Prime Capital Investment Advisors. The performance of those funds may be substantially different than the performance of the broad asset classes and to proxy ETFs represented here. U.S. Bonds (iShares Core U.S. Aggregate Bond ETF); High‐YieldBond(iShares iBoxx $ High Yield Corporate Bond ETF); Intl Bonds (SPDR® Bloomberg Barclays International Corporate Bond ETF); Large Growth (iShares Russell 1000 Growth ETF); Large Value (iShares Russell 1000 ValueETF);MidGrowth(iSharesRussell Mid‐CapGrowthETF);MidValue (iSharesRussell Mid‐Cap Value ETF); Small Growth (iShares Russell 2000 Growth ETF); Small Value (iShares Russell 2000 Value ETF); Intl Equity (iShares MSCI EAFE ETF); Emg Markets (iShares MSCI Emerging Markets ETF); and Real Estate (iShares U.S. Real Estate ETF). The return displayed as “Allocation” is a weighted average of the ETF proxies shown as represented by: 30% U.S. Bonds, 5% International Bonds, 5% High Yield Bonds, 10% Large Growth, 10% Large Value, 4% Mid Growth, 4%Mid Value, 2% Small Growth, 2% Small Value, 18% International Stock, 7% Emerging Markets, 3% Real Estate.
Advisory services offered through Prime Capital Investment Advisors, LLC. (“PCIA”), a Registered Investment Adviser. PCIA doing business as Prime Capital Wealth Management (“PCWM”) and Qualified Plan Advisors (“QPA”).
© 2021 Prime Capital Investment Advisors, 6201 College Blvd., Suite #150, Overland Park, KS 66211.