
Quick Takes
- Risk Assets Decimated. April was a bloody month for risk assets across the board. Equities, both domestic and abroad, sold off significantly for the month of April and Bonds, offered little to no protection from the pain.
- Has Inflation Finally Peaked? On the heels of the Fed initiating interest rate liftoff and offering some details on their path to quantitative tightening, Core CPI came in softer than expected. While this is encouraging, it is still too early to tell if Inflation has peaked and will show signs of normalizing.
- Greenback Soars To 5 Year High. As the Fed gave more clarity to their quantitative tightening process, the dollar took off for the month of April and reached a 5-year high of 103.928 at the end of the month.
- Economic Production, Labor Markets, and Inflation. GDP missed the mark for the month of April, falling -1.4% versus expectations of +1.0%. Inflation, as measured by Core CPI, came in below expectations for the month of April. Labor markets appear to have leveled off for the month of April with most of the high frequency data coming roughly in-line with market participant expectations
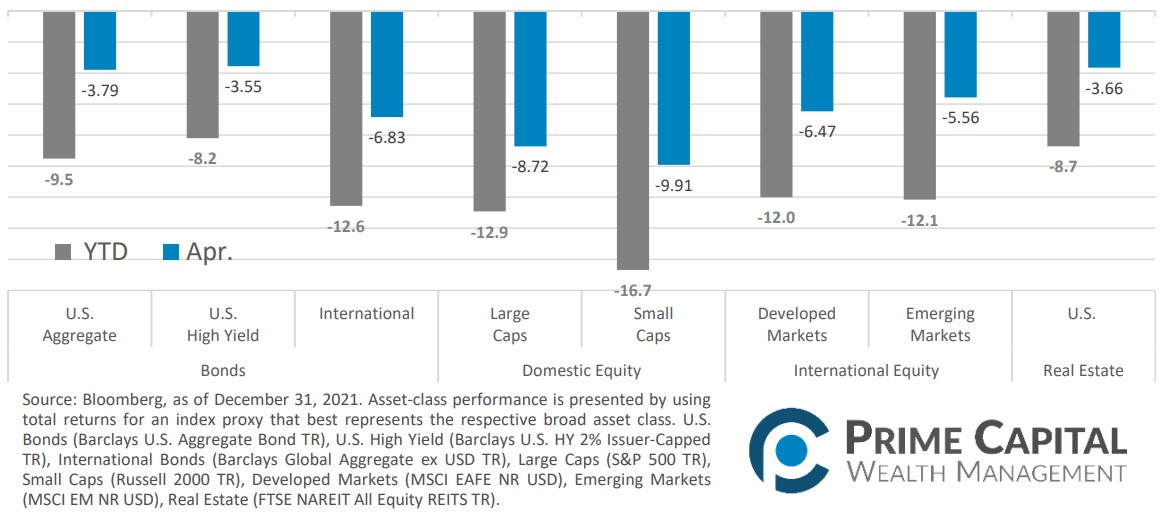
Asset Class Performance
The tough year for risk assets continued through April with all major asset classes posting a negative month for April and deepened their year-to-date rut. In times of volatility, bonds typically offer a measure of downside protection, but with the Fed determined to combat inflation via interest rate increases, fixed income offered little safety.
Markets & Macroeconomics
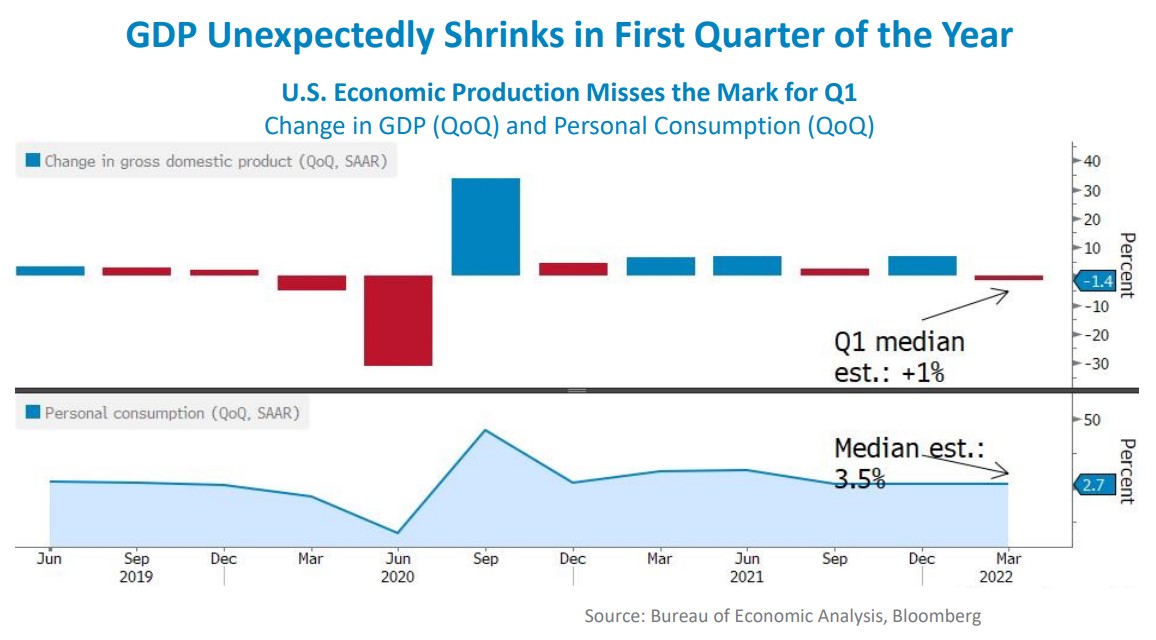
For the first time since the start of global pandemic, U.S. GDP fell by -1.4% on an annualized basis in the first quarter of the year, widely missing expectations for an expansion of +1.0% on an annualized basis. Digging into the underlying data, the contraction was due to a large increase in imports and drop in exports. However, on a year-over-year basis, GDP grew by +3.6%. This illustrates how volatile economic production numbers calculations can be from quarter-to-quarter. Given that the calculation methodology leads to volatile quarter-over-quarter readings, market participants ultimately weren’t overly concerned that the headline number was negative and were encourage by the consumer spending and business investment portions of the data. With Core CPI, which excludes the more volatile components of energy and food prices, coming in below consensus estimates, this may mean that inflation has finally peaked. Ultimately, the implications for both the economic production and inflation readings will materialize through the Federal Reserve’s monetary tightening policy, which will consist of raising interest rates and their balance sheet runoff. Fed speakers throughout the month of April have stated that fighting inflation is their main priority and that may lead to a more aggressive tightening plan than originally communicated.
At the Fed’s meeting in May, they are anticipated to raise interest rates by 50bps and further guidance on their balance sheet runoff is expected during the press conference following the meeting. The Fed is currently in a precarious position where the committee must maintain loose enough monetary policy to continue positive economic growth, while tightening monetary policy enough to bring inflation back to its target range. A misstep in either direction could have lasting effects on not only the U.S. economy, but also financial markets both domestic and abroad.
Bottom Line: U.S. GDP contracted for the first quarter of the year and inflation, as measured by Core CPI, showed the initial signs that inflation may have peaked on the heels of the Fed’s interest rate liftoff. While market participants chalked up the economic contraction as temporary, expecting the robust consumer spending and business investment to prop up GDP numbers for the rest of the year, this further illustrates the tightrope that the Fed must walk for the rest of the year, balancing taming inflation while still maintaining a loose enough monetary policy to encourage continued economic growth.
©2022 Prime Capital Investment Advisors, LLC. The views and information contained herein are (1) for informational purposes only, (2) are not to be taken as a recommendation to buy or sell any investment, and (3) should not be construed or acted upon as individualized investment advice. The information contained herein was obtained from sources we believe to be reliable but is not guaranteed as to its accuracy or completeness. Investing involves risk. Investors should be prepared to bear loss, including total loss of principal. Diversification does not guarantee investment returns and does not eliminate the risk of loss. Past performance is no guarantee of comparable future results.
Source: Bloomberg. Asset‐class performance is presented by using market returns from an exchange‐traded fund (ETF) proxy that best represents its respective broad asset class. Returns shown are net of fund fees for and do not necessarily represent performance of specific mutual funds and/or exchange-traded funds recommended by the Prime Capital Investment Advisors. The performance of those funds June be substantially different than the performance of the broad asset classes and to proxy ETFs represented here. U.S. Bonds (iShares Core U.S. Aggregate Bond ETF); High‐Yield Bond (iShares iBoxx $ High Yield Corporate Bond ETF); Intl Bonds (SPDR® Bloomberg Barclays International Corporate Bond ETF); Large Growth (iShares Russell 1000 Growth ETF); Large Value (iShares Russell 1000 Value ETF); Mid Growth (iShares Russell Mid-Cap Growth ETF); Mid Value (iShares Russell Mid-Cap Value ETF); Small Growth (iShares Russell 2000 Growth ETF); Small Value (iShares Russell 2000 Value ETF); Intl Equity (iShares MSCI EAFE ETF); Emg Markets (iShares MSCI Emerging Markets ETF); and Real Estate (iShares U.S. Real Estate ETF). The return displayed as “Allocation” is a weighted average of the ETF proxies shown as represented by: 30% U.S. Bonds, 5% International Bonds, 5% High Yield Bonds, 10% Large Growth, 10% Large Value, 4% Mid Growth, 4% Mid Value, 2% Small Growth, 2% Small Value, 18% International Stock, 7% Emerging Markets, 3% Real Estate.
Advisory services offered through Prime Capital Investment Advisors, LLC. (“PCIA”), a Registered Investment Adviser. PCIA doing business as Prime Capital Wealth Management (“PCWM”) and Qualified Plan Advisors (“QPA”).
© 2022 Prime Capital Investment Advisors, 6201 College Blvd., Suite #150, Overland Park, KS 66211.