
Quick Takes
- Risk Assets Decimated. April was a bloody month for risk assets across the board. Equities, both domestic and abroad, sold off significantly for the month of April and Bonds, offered little to no protection from the pain.
- Has Inflation Finally Peaked? On the heels of the Fed initiating interest rate liftoff and offering some details on their path to quantitative tightening, Core CPI came in softer than expected. While this is encouraging, it is still too early to tell if Inflation has peaked and will show signs of normalizing.
- Greenback Soars To 5 Year High. As the Fed gave more clarity to their quantitative tightening process, the dollar took off for the month of April and reached a 5-year high of 103.928 at the end of the month.
- Economic Production, Labor Markets, and Inflation. GDP missed the mark for the month of April, falling -1.4% versus expectations of +1.0%. Inflation, as measured by Core CPI, came in below expectations for the month of April. Labor markets appear to have leveled off for the month of April with most of the high frequency data coming roughly in-line with market participant expectations
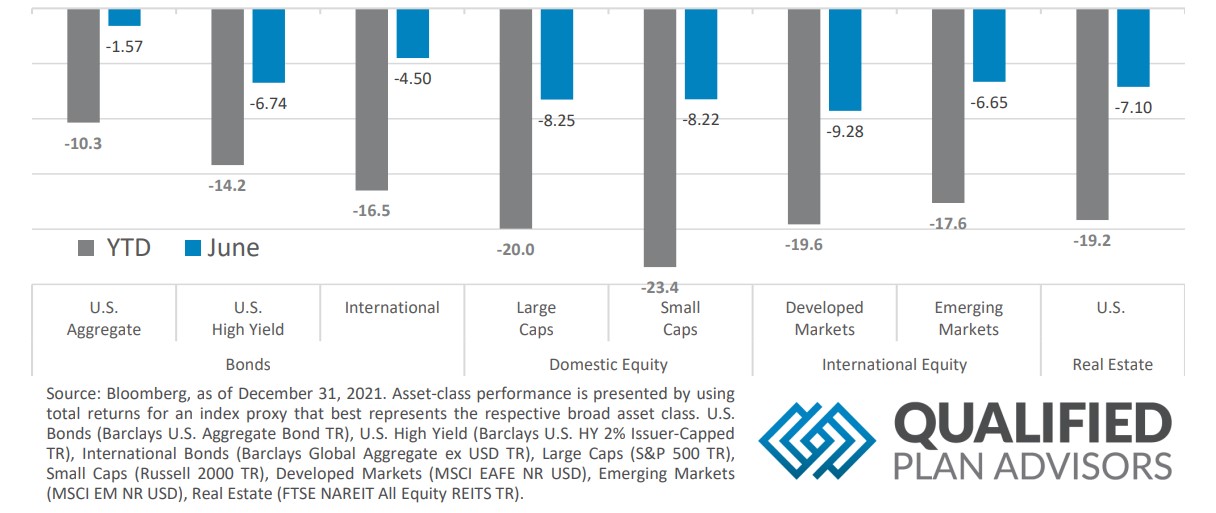
Asset Class Performance
Sellers returned to the market after taking a brief pause in May. Risk Assets were negative for the month across the board and across the globe. International Developed markets had the biggest drawdown for June, with US Small Cap stocks following closely behind. Bonds offered some downside protection for the month, but were still in the red.
Markets & Macroeconomics
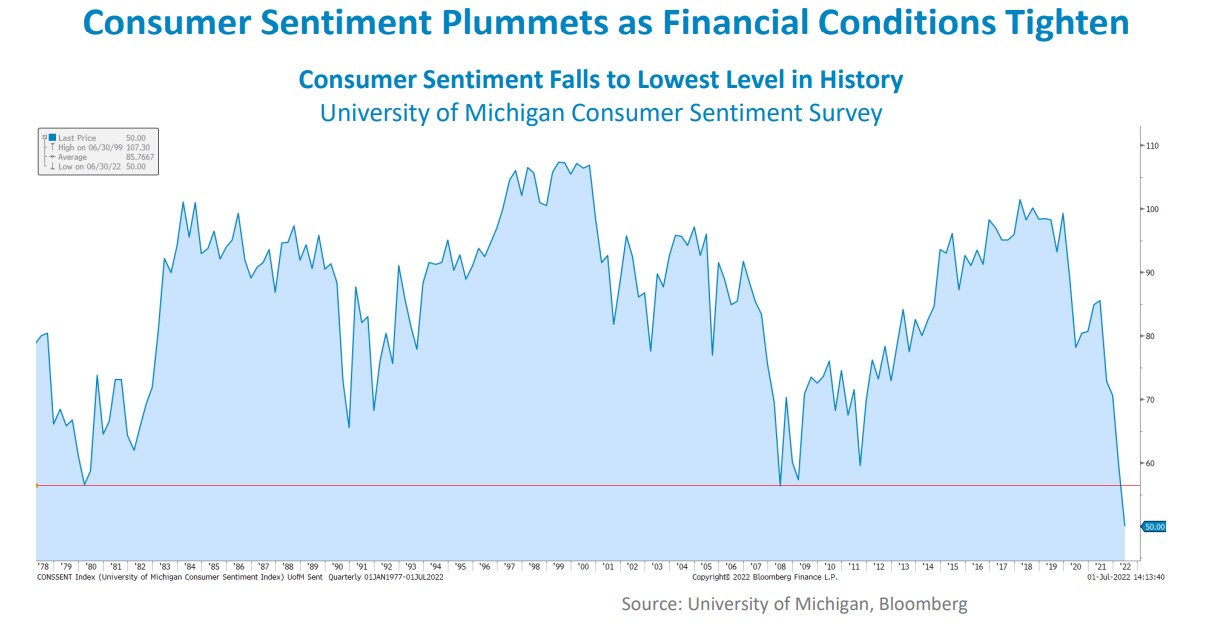
After the Fed enacted a supersized 75bps interest rate hike during their June meeting, Consumer Sentiment, as measured by the University of Michigan Consumer Sentiment Survey, fell to its lowest level in history. The previous record low occurred during the Great Financial Crisis of 2008 when the financial system was wrought with systemic issues, which was only slightly lower than the 1980s when inflation, as measured by the Consumer Price Index, was running close to 15% on an annualized basis. The FOMC made this decision on the heels of an inflation reading, as measured by the Consumer Price Index, which came in well above expectations of +8.3% at +8.6% for the month of May on an annualized basis. Throughout the month, FOMC members’ rhetoric continued to promise that taming runaway inflation was their top priority. Chairman Powell gave guidance during his press conference that they do not anticipate rate hikes of this magnitude in future hikes but left some wiggle room by saying that a 75bps hike for the next meeting in July is not off the table. With the Fed increasing their pace of the tightening of financial conditions, the effects of this policy regime are reverberating across the economy. As mentioned above, consumers are feeling the pressure of this tightening as evidenced by Consumer Sentiment falling to its lowest level in history, additionally, GDP for the first quarter of the year came in below expectations of -1.5%, landing at -1.6% on an annualized basis. With this being the second reading in a row of contraction in economic production, as measured by change in GDP, the U.S. economy is in what is called a technical recession. While concerning, GDP readings are often volatile due to the inexact science that goes into the calculation methodologies, which often leads to market participants taking these readings with a grain of salt. Regardless, it seems that the strong labor market is the one area of the US economy that continues to boom, cushioning the impact of the contraction in economic production.
Bottom Line: The Fed continued to tighten monetary policy and upped their game in June by enacting a 75bps hike in interest rates. The effects of this tightening are hitting consumers hard with Consumer Sentiment falling to its lowest levels in history. Consumers aren’t the only ones feeling the pressure, as this tightening has led to a contraction in GDP numbers for the second quarter in a row, landing the US economy in a technical recession. Despite this, the labor market remains strong and may prop up the economy.
©2022 Prime Capital Investment Advisors, LLC. The views and information contained herein are (1) for informational purposes only, (2) are not to be taken as a recommendation to buy or sell any investment, and (3) should not be construed or acted upon as individualized investment advice. The information contained herein was obtained from sources we believe to be reliable but is not guaranteed as to its accuracy or completeness. Investing involves risk. Investors should be prepared to bear loss, including total loss of principal. Diversification does not guarantee investment returns and does not eliminate the risk of loss. Past performance is no guarantee of comparable future results.
Source: Bloomberg. Asset‐class performance is presented by using market returns from an exchange‐traded fund (ETF) proxy that best represents its respective broad asset class. Returns shown are net of fund fees for and do not necessarily represent performance of specific mutual funds and/or exchange-traded funds recommended by the Prime Capital Investment Advisors. The performance of those funds June be substantially different than the performance of the broad asset classes and to proxy ETFs represented here. U.S. Bonds (iShares Core U.S. Aggregate Bond ETF); High‐Yield Bond (iShares iBoxx $ High Yield Corporate Bond ETF); Intl Bonds (SPDR® Bloomberg Barclays International Corporate Bond ETF); Large Growth (iShares Russell 1000 Growth ETF); Large Value (iShares Russell 1000 Value ETF); Mid Growth (iShares Russell Mid-Cap Growth ETF); Mid Value (iShares Russell Mid-Cap Value ETF); Small Growth (iShares Russell 2000 Growth ETF); Small Value (iShares Russell 2000 Value ETF); Intl Equity (iShares MSCI EAFE ETF); Emg Markets (iShares MSCI Emerging Markets ETF); and Real Estate (iShares U.S. Real Estate ETF). The return displayed as “Allocation” is a weighted average of the ETF proxies shown as represented by: 30% U.S. Bonds, 5% International Bonds, 5% High Yield Bonds, 10% Large Growth, 10% Large Value, 4% Mid Growth, 4% Mid Value, 2% Small Growth, 2% Small Value, 18% International Stock, 7% Emerging Markets, 3% Real Estate.
Advisory services offered through Prime Capital Investment Advisors, LLC. (“PCIA”), a Registered Investment Adviser. PCIA doing business as Prime Capital Wealth Management (“PCWM”) and Qualified Plan Advisors (“QPA”).
© 2022 Prime Capital Investment Advisors, 6201 College Blvd., Suite #150, Overland Park, KS 66211.