
Quick Takes
- Risk Assets Deepen Selloff. Risk assets continued their year‐to‐date decline as the Fed conducted another supersized 75bps hike in interest rates and Fed speak commentary took on a hawkish tone.
- Inflation Surprises In A Bad Way. Inflation, as measured by the Consumer Price Index (CPI), took market participants by surprise and increased for the month of August. Other inflation metrics like Producers Price Index and Personal Consumption Expenditures also showed signs of heating up, much to market participants’ chagrin.
- Dollar Climbs Higher, Pound Collapses. The dollar spent most of the month climbing higher and picked up steam after the United Kingdoms announced a plan to cut taxes, this news sent the British Pound into a steep decline. This abated at the end of the month as the UK’s central bank returned to bond buying.
- GDP and Labor Markets. GDP for the second quarter of the year dropped yet again on the quarter‐over‐quarter metric. Labor markets remained tight despite the Fed’s tightening of monetary policy with weekly jobless claims for the majority of the month.
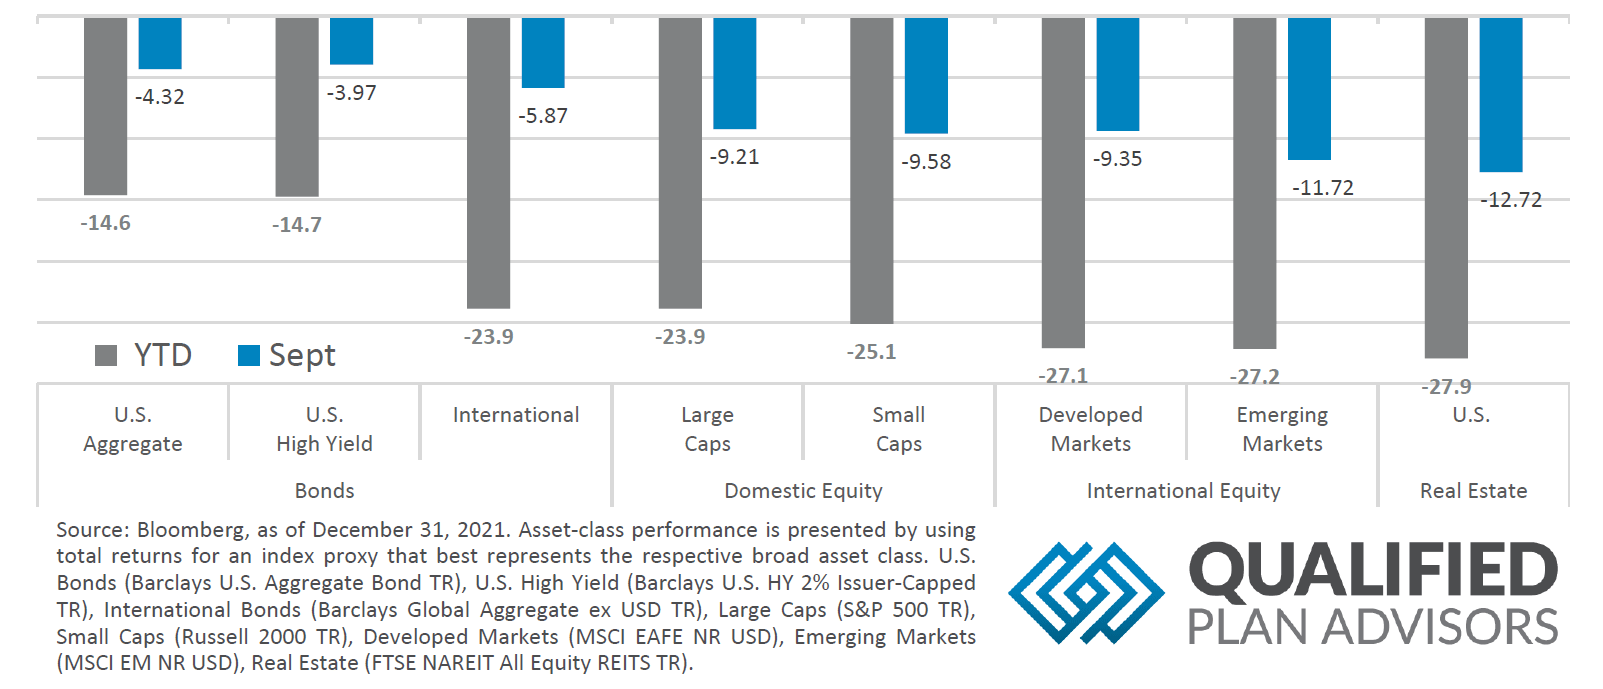
Asset Class Performance
With inflation metrics coming in hot for the previous month combined with the supersized 75bps interest rate hike and hawkish commentary from Fed members, markets across almost all major asset classes declined for the month, deepening their year‐to‐date losses.
Markets & Macroeconomics
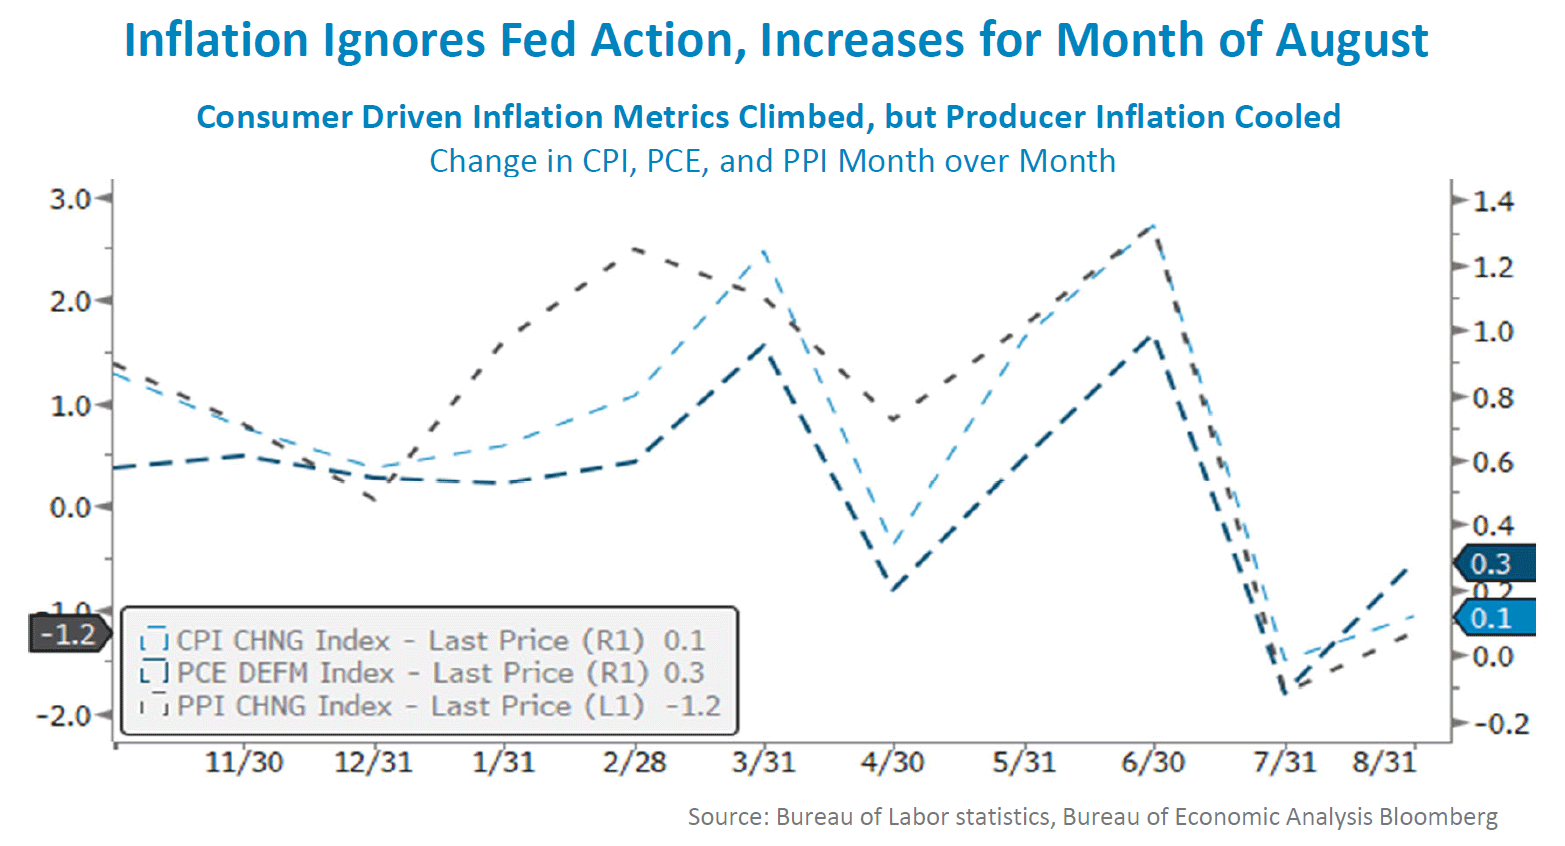
Despite the recent monetary tightening actions taken by the Fed, the effects of quantitative tightening and increasing the Fed Funds Target Rate has yet to reverberate to inflation. As illustrated in the chart above the Consumer Price Index (CPI) and the PCE (Personal Consumption Expenditure) Deflator, the Fed’s preferred inflation tracking metric, both climbed for the month of August. Both metrics rose by more than survey estimates on the month‐over‐month measure. While certainly not the desired outcome of the Fed and market participants alike, one area that showed some signs of stabilizing was the Producer Price Index (PPI). The PPI is an inflation measure for goods manufacturers and landed mostly inline with expectations for the month of August. Producers have been plagued by supply chain constraints since the start of the global pandemic and have not been able to keep pace with demand. As the Fed’s actions work their way through the economy and supply chains recover, goods inflation should begin to stabilize, and the September release of PPI numbers could be hinting that this is beginning to happen. With CPI numbers coming in hotter than expected and PPI showing early signs of stabilizing, it appears that consumer spending has shifted from physical goodsoriented purchases to more service‐oriented purchases.
While the effects of the Fed’s recent tightening actions may not have made their way through the economic system, one area of continued concern is the labor market. Despite many public companies recently announcing hiring freezes, with some even announcing layoff plans, high frequency datapoints, like weekly jobless claims and weekly continuing claims, illustrated throughout the month of September that jobs are not difficult to find labor seekers. It is likely that the Fed will continue to tighten until labor markets show signs of slackening to a more sustainable long‐term level. Once labor markets reach the Fed’s acceptable level, income should also stabilize, which should lead to moderating consumer spending.
Bottom Line: Last month’s reading on inflation related data gave market participants false hope that inflation was beginning to show signs of moderating. Most inflation metrics released for the month of September showed that August’s inflation still increased, despite the Fed’s tightening of monetary policy. High frequency labor market data releases also hinted that the labor market remains ever tight and that the Fed’s fight against inflation is not over yet.
©2022 Prime Capital Investment Advisors, LLC. The views and information contained herein are (1) for informational purposes only, (2) are not to be taken as a recommendation to buy or sell any investment, and (3) should not be construed or acted upon as individualized investment advice. The information contained herein was obtained from sources we believe to be reliable but is not guaranteed as to its accuracy or completeness. Investing involves risk. Investors should be prepared to bear loss, including total loss of principal. Diversification does not guarantee investment returns and does not eliminate the risk of loss. Past performance is no guarantee of comparable future results.
Source: Bloomberg. Asset‐class performance is presented by using market returns from an exchange‐traded fund (ETF) proxy that best represents its respective broad asset class. Returns shown are net of fund fees for and do not necessarily represent performance of specific mutual funds and/or exchange-traded funds recommended by the Prime Capital Investment Advisors. The performance of those funds June be substantially different than the performance of the broad asset classes and to proxy ETFs represented here. U.S. Bonds (iShares Core U.S. Aggregate Bond ETF); High‐Yield Bond (iShares iBoxx $ High Yield Corporate Bond ETF); Intl Bonds (SPDR® Bloomberg Barclays International Corporate Bond ETF); Large Growth (iShares Russell 1000 Growth ETF); Large Value (iShares Russell 1000 Value ETF); Mid Growth (iShares Russell Mid-Cap Growth ETF); Mid Value (iShares Russell Mid-Cap Value ETF); Small Growth (iShares Russell 2000 Growth ETF); Small Value (iShares Russell 2000 Value ETF); Intl Equity (iShares MSCI EAFE ETF); Emg Markets (iShares MSCI Emerging Markets ETF); and Real Estate (iShares U.S. Real Estate ETF). The return displayed as “Allocation” is a weighted average of the ETF proxies shown as represented by: 30% U.S. Bonds, 5% International Bonds, 5% High Yield Bonds, 10% Large Growth, 10% Large Value, 4% Mid Growth, 4% Mid Value, 2% Small Growth, 2% Small Value, 18% International Stock, 7% Emerging Markets, 3% Real Estate.
Advisory services offered through Prime Capital Investment Advisors, LLC. (“PCIA”), a Registered Investment Adviser. PCIA doing business as Prime Capital Wealth Management (“PCWM”) and Qualified Plan Advisors (“QPA”).
© 2022 Prime Capital Investment Advisors, 6201 College Blvd., Suite #150, Overland Park, KS 66211.