
Quick Takes
- Risk Assets Recover. Bolstered by high consumer sentiment, risk assets rebounded in February. Most asset classes posted strong gains, reversing January’s losses incurred when investor risk tolerance waned.
- Inflation Cools Further. Inflation, measured by the Fed’s preferred gauge (PCE Deflator), continued its downward trend, falling to 2.8% year-over-year in February from 2.9% in January. Despite this positive development, investors now anticipate the Fed delaying potential rate cuts until June.
- Greenback Rally Pauses. After nearly two months of gains to start the year, the US dollar (greenback) experienced a buying slowdown in late February. This shift coincides with revised expectations around future Federal Reserve interest rate cuts, which are now anticipated to occur later than initially projected.
- Personal Spending and Labor Markets. The 0.2% growth in February personal spending, meeting expectations, suggests potentially stable consumer confidence despite the January retail sales decline. Positive signs emerged from the February labor market with reports indicating job growth exceeding expectations and unemployment remaining steady.
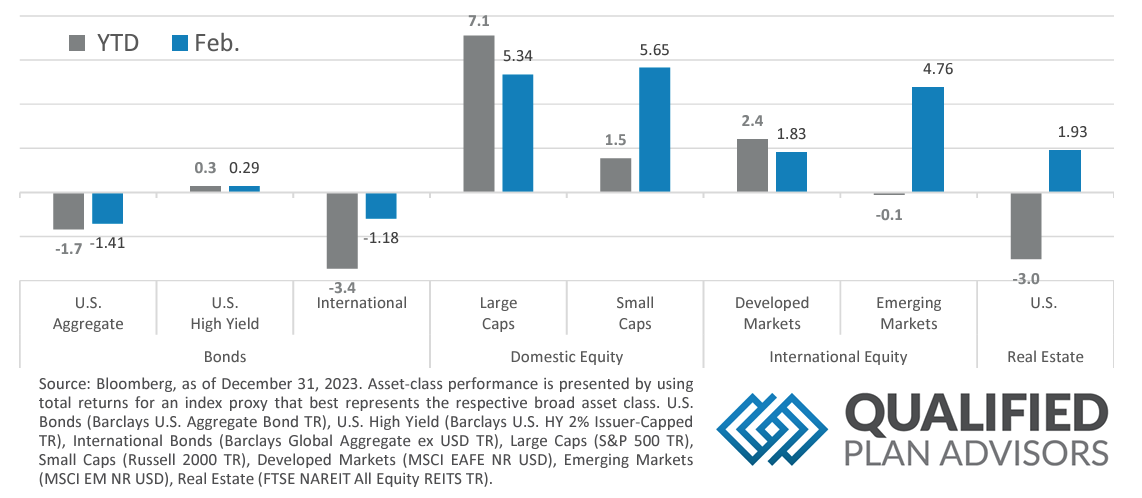
Asset Class Performance
After a challenging start to 2024, risk assets experienced a recovery in February. Among them, small-cap stocks, emerging markets, and real estate saw the most significant rebounds, following a weak January. Large-cap stocks continued their strong performance, bringing their YTD figure to 7.1%.
Markets & Macroeconomics
January retail sales dipped amidst mixed signals. Retail sales in January experienced a broader-than-expected decline of 0.8% compared to December, following a downward revision of the previous month’s figures. This drop marks the most significant decrease in nearly a year, suggesting a potential pause in consumer spending following the robust holiday season. However, it’s crucial to interpret this data within a broader economic context. While the retail sales report and a separate report showing a decline in US factory production could indicate a loss of momentum in January, they shouldn’t be viewed as harbingers of a significant economic slowdown. Several factors suggest continued consumer resilience: a strong job market provides income stability and confidence, allowing them to maintain spending levels. Additionally, recent signs of easing inflation offer some relief to household budgets, potentially freeing up additional disposable income. Furthermore, the retail sales report doesn’t capture the entirety of consumer spending. It primarily focuses on merchandise purchases, which represent a relatively limited portion of total consumer outlays. Additionally, various economists attribute the broad-based weakness in January to the severe winter weather that impacted parts of the US, potentially disrupting normal buying patterns. Analyzing the January retail sales data alongside other economic indicators, such as employment figures, inflation trends, and consumer confidence surveys, is crucial to gain a more comprehensive understanding of the current economic climate. This broader analysis helps to avoid drawing premature conclusions about the health of the economy based on a single data point.
Bottom Line: January retail sales experienced a steeper-than-expected 0.8% decline, marking the sharpest drop in nearly a year. This could signal a post-holiday spending pause but shouldn’t be interpreted in isolation. While both retail sales and factory production data suggest a January slowdown, factors like a strong job market and easing inflation paint a picture of continued consumer resilience. It’s important to remember that the retail report focuses primarily on merchandise purchases, which represent a limited portion of overall consumer spending. Additionally, some economists attribute the January weakness to severe winter weather that disrupted normal buying patterns. To gain a better understanding of the current economic climate, it’s crucial to analyze the January retail sales data alongside other economic indicators, such as employment figures, inflation trends, and consumer confidence surveys. This broader analysis helps to avoid drawing premature conclusions about the health of the economy based on a single data point.
©2023 Prime Capital Investment Advisors, LLC. The views and information contained herein are (1) for informational purposes only, (2) are not to be taken as a recommendation to buy or sell any investment, and (3) should not be construed or acted upon as individualized investment advice. The information contained herein was obtained from sources we believe to be reliable but is not guaranteed as to its accuracy or completeness. Investing involves risk. Investors should be prepared to bear loss, including total loss of principal. Diversification does not guarantee investment returns and does not eliminate the risk of loss. Past performance is no guarantee of comparable future results.
Source: Bloomberg. Asset‐class performance is presented by using market returns from an exchange‐traded fund (ETF) proxy that best represents its respective broad asset class. Returns shown are net of fund fees for and do not necessarily represent performance of specific mutual funds and/or exchange-traded funds recommended by the Prime Capital Investment Advisors. The performance of those funds June be substantially different than the performance of the broad asset classes and to proxy ETFs represented here. U.S. Bonds (iShares Core U.S. Aggregate Bond ETF); High‐Yield Bond (iShares iBoxx $ High Yield Corporate Bond ETF); Intl Bonds (SPDR® Bloomberg Barclays International Corporate Bond ETF); Large Growth (iShares Russell 1000 Growth ETF); Large Value (iShares Russell 1000 Value ETF); Mid Growth (iShares Russell Mid-Cap Growth ETF); Mid Value (iShares Russell Mid-Cap Value ETF); Small Growth (iShares Russell 2000 Growth ETF); Small Value (iShares Russell 2000 Value ETF); Intl Equity (iShares MSCI EAFE ETF); Emg Markets (iShares MSCI Emerging Markets ETF); and Real Estate (iShares U.S. Real Estate ETF). The return displayed as “Allocation” is a weighted average of the ETF proxies shown as represented by: 30% U.S. Bonds, 5% International Bonds, 5% High Yield Bonds, 10% Large Growth, 10% Large Value, 4% Mid Growth, 4% Mid Value, 2% Small Growth, 2% Small Value, 18% International Stock, 7% Emerging Markets, 3% Real Estate.
Advisory products and services offered by Investment Adviser Representatives through Prime Capital Investment Advisors, LLC (“PCIA”), a federally registered investment adviser. PCIA: 6201 College Blvd., Suite#150, Overland Park, KS 66211. PCIA doing business as Prime Capital Wealth Management (“PCWM”) and Qualified Plan Advisors (“QPA”). Securities offered by Registered Representatives through Private Client Services, Member FINRA/SIPC. PCIA and Private Client Services are separate entities and are not affiliated.
© 2023 Prime Capital Investment Advisors, 6201 College Blvd., Suite #150, Overland Park, KS 66211.