
Quick Takes
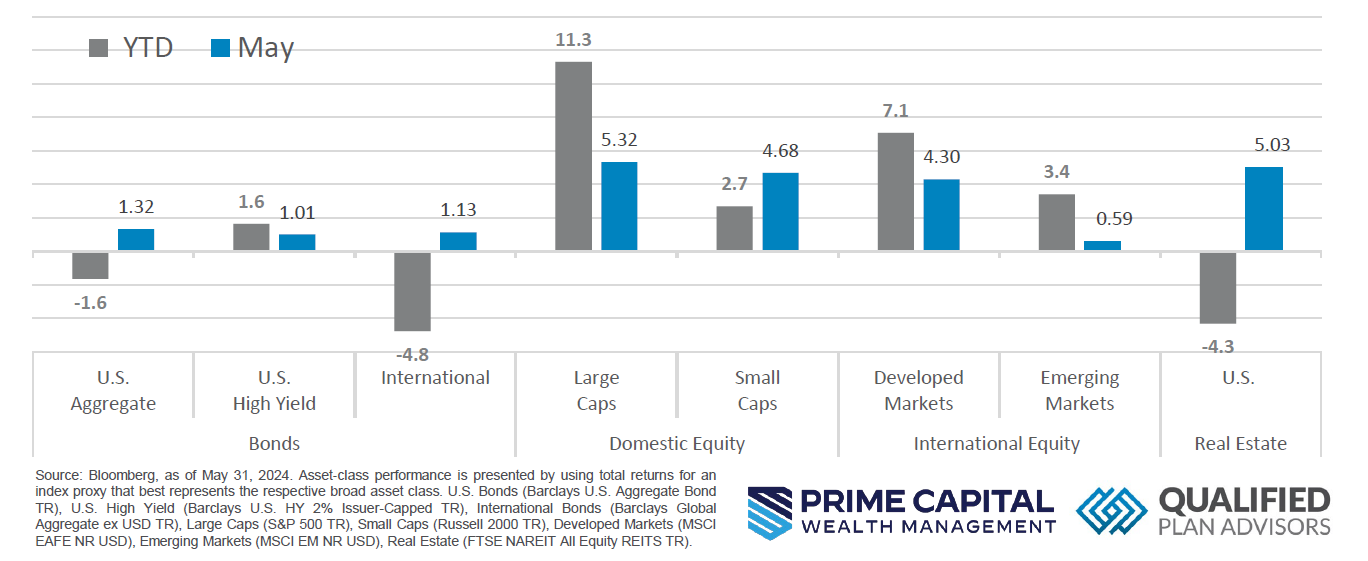
- Risk Assets Rebounded In May. After April’s losses, all asset classes delivered positive returns, with strong performances from large cap stocks and developed and emerging markets. However, year-to-date, U.S. and international bonds, along with real estate, remain in negative territory.
- Inflation Shows Signs of Cooling. Core inflation showed promising signs of cooling, with declines in durable goods prices and moderations in health care and housing costs. Despite some lingering price pressures, recent trends indicate a gradual disinflation process, prompting the Fed to take a cautious stance and await more data before considering rate cuts.
- The Dollar’s First Decline of 2024. Disappointing GDP data and mounting “debt cliff” worries triggered a decline in the U.S. dollar index, its first this year. Rising bond yields, as investors demanded higher returns to hold U.S. treasuries, further pressured the dollar. This benefitted precious metals, pushing their prices up.
- Job Growth Surges, Unemployment Rises. The May jobs report showed an increase of 339,000 jobs, with strong gains averaging 283,000 over the past three months. The unemployment rate rose to 3.7% from 3.4% in April. Average hourly earnings increased by 0.3% for the month, reflecting a 4.3% annual growth.
Asset Class Performance
Following a challenging month in April, risk asset classes exhibited a positive trend in May. All asset classes generated returns this month, with Large Cap stocks, Developed Markets, and Emerging Markets leading the performance. However, U.S. Aggregate Bonds, International Bonds, and Real Estate continue to lag year-to-date.
Markets & Macroeconomics
In May 2024, the U.S. economy exhibited slower growth and inflation patterns. The GDP grew at an annual rate of 1.3% in the first quarter, down from an initial estimate of 1.6%, largely due to weaker consumer spending on goods, especially autos. This slowdown marks a significant loss of momentum compared to the previous year’s performance, influenced by high interest rates, reduced pandemic-era savings, and slower income growth. Personal spending increased by 2.0%, a revision from the earlier estimate of 2.5%, while federal government spending decelerated and imports rose, leading to a negative impact on net exports for the first time in two years. Despite these challenges, stronger business and residential investments provided some offset. A crucial indicator of domestic demand, final sales to private domestic purchasers, increased by 2.8%, indicating underlying demand strength. Simultaneously, core inflation showed signs of cooling, with durable goods prices declining and moderations in health care and housing inflation. While annual inflation rates remained steady, the disinflation process appeared more pronounced in detailed metrics. Core PCE inflation displayed encouraging trends, with one- and three-month annualized rates dropping to 3.03% and 3.46%, respectively, and the six-month rate rising slightly to 3.18%. Supercore PCE, a key measure preferred by the Fed, fell to 0.26%, largely due to lower airfares. However, financial-services inflation saw a rise due to higher charges for portfolio management and advisory services. These developments may prompt the Fed to adopt a cautious stance, preferring to gather more data before considering rate cuts, despite the positive indicators from the April inflation report.
Bottom Line: In May 2024, U.S. industrial production stagnated, with manufacturing output falling due to a decline in motor-vehicle production and other sectors. Rising input costs and inconsistent demand continue to challenge the manufacturing sector. Meanwhile, new home sales dropped by 4.7%, hindered by high prices and mortgage rates, despite builders increasing supply to address shortages in the resale market. Despite these challenges, the median sales price of new homes rose by 3.9% from the previous year. Capacity utilization at factories fell to 76.9%, indicating a broader struggle within the industrial sector. Homebuilders have been actively constructing new homes to compensate for the limited resale market inventory.
©2024 Prime Capital Investment Advisors, LLC. The views and information contained herein are (1) for informational purposes only, (2) are not to be taken as a recommendation to buy or sell any investment, and (3) should not be construed or acted upon as individualized investment advice. The information contained herein was obtained from sources we believe to be reliable but is not guaranteed as to its accuracy or completeness. Investing involves risk. Investors should be prepared to bear loss, including total loss of principal. Diversification does not guarantee investment returns and does not eliminate the risk of loss. Past performance is no guarantee of comparable future results.
Source: Sources for this market commentary derived from Bloomberg Asset-class performance is presented by using market returns from an exchange‐traded fund (ETF) proxy that best represents its respective broad asset class. Returns shown are net of fund fees for and do not necessarily represent performance of specific mutual funds and/or exchange-traded funds recommended by the Prime Capital Investment Advisors. The performance of those funds June be substantially different than the performance of the broad asset classes and to proxy ETFs represented here. U.S. Bonds (iShares Core U.S. Aggregate Bond ETF); High‐Yield Bond (iShares iBoxx $ High Yield Corporate Bond ETF); Intl Bonds (SPDR® Bloomberg Barclays International Corporate Bond ETF); Large Growth (iShares Russell 1000 Growth ETF); Large Value (iShares Russell 1000 Value ETF); Mid Growth (iShares Russell Mid-Cap Growth ETF); Mid Value (iShares Russell Mid-Cap Value ETF); Small Growth (iShares Russell 2000 Growth ETF); Small Value (iShares Russell 2000 Value ETF); Intl Equity (iShares MSCI EAFE ETF); Emg Markets (iShares MSCI Emerging Markets ETF); and Real Estate (iShares U.S. Real Estate ETF). The return displayed as “Allocation” is a weighted average of the ETF proxies shown as represented by: 30% U.S. Bonds, 5% International Bonds, 5% High Yield Bonds, 10% Large Growth, 10% Large Value, 4% Mid Growth, 4% Mid Value, 2% Small Growth, 2% Small Value, 18% International Stock, 7% Emerging Markets, 3% Real Estate.
Advisory products and services offered by Investment Adviser Representatives through Prime Capital Investment Advisors, LLC (“PCIA”), a federally registered investment adviser. PCIA: 6201 College Blvd., Suite#150, Overland Park, KS 66211. PCIA doing business as Prime Capital Wealth Management (“PCWM”) and Qualified Plan Advisors (“QPA”). Securities offered by Registered Representatives through Private Client Services, Member FINRA/SIPC. PCIA and Private Client Services are separate entities and are not affiliated.
© 2024 Prime Capital Investment Advisors, 6201 College Blvd., Suite #150, Overland Park, KS 66211.