
The Bottom Line
● Even with US Markets closed on Monday for Martin Luther King Jr. Day, global equities continued their steady selloff throughout the week.
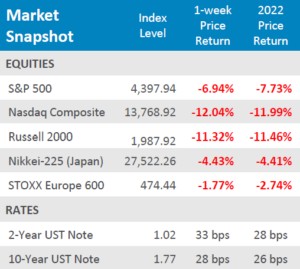
● As equities continued their sell off, yields jumped yet again. The yield on the 10-Year US Treasury Note rose by + 28bps and the yield on the 2-Year was up +33bps for the week.
● Economic data for the week showed manufacturing weakness in New York with Empire Manufacturing missing expectations in a big way, but Philadelphia Fed Business Outlook told a different story for the Northeast. There were also some encouraging readings from the housing sector this week.
Can’t Stop, Won’t Stop Selling Off
Global equities deepened their rut, with the tech heavy Nasdaq Composite falling -12.04% for the week, now down -11.99% for 2022. Small Cap equities, as measured by the Russell 2000, weren’t far behind, losing -11.32% for the week and down -11.46% for the year thus far. The S&P 500 was able to post a slightly better week, but still deeply in the red. The S&P 500 was down -6.94% for the week and -7.73%for the year so far. International equities faired even better than the S&P 500 but are also still in the red for both the week and year to date. European equities, as measured by the STOXX Europe 600, were down -1.77% for the week and -2.74% for 2022. Japanese equities, as measured by the Nikkei-225, were down -4.43% for the week and -4.41% for the year thus far. Market participants are eagerly awaiting the FOMC Rate Decision for next week. Currently, traders are not anticipating any sort of liftoff in the Fed Funds rate, but they will carefully pick over the language and semantics of the press conference to follow the Fed’s meeting. Expectations have been set for the tapering process to end in March and for the first hike in interest rates to follow in that same month.
Digits & Did You Knows
SAFE MONEY –From 01/01/2020 (before the pandemic) to 01/05/20222, the size of the money market fund industry in the USA (both taxable and tax-free) rose from $3.6 trillion to $4.7 trillion. (source: Bureau Investment Co. Institute, BTN Research).
ESTATE TAXES –The maximum amount that a deceased individual may pass onto his/her heirs federally estate-tax free (with proper planning) rose to $12.06 million in 2022, up from $11.7 million in 2021. The limit was $1 million in 2002 or 20 years ago. (source: Internal Revenue Service , BTN Research).
A LOT FEWER –There were 1.53 million homes for sale nationwide as of 12/31/2018. Nearly 3 years later, there were 1.11 million homes for sale nationwide as of 11/30/2021.
(source: National Association of Realtors, BTN Research)
Click here to see the full review.
—
Source: Bloomberg. Asset-class performance is presented by using market returns from an exchange-traded fund (ETF) proxy that best represents its respective broad asset class. Returns shown are net of fund fees for and do not necessarily represent performance of specific mutual funds and/or exchange-traded funds recommended by the Prime Capital Investment Advisors. The performance of those funds may be substantially different than the performance of the broad asset classes and to proxy ETFs represented here. U.S. Bonds (iShares Core U.S. Aggregate Bond ETF); High-Yield Bond (iShares iBoxx $ High Yield Corporate Bond ETF); Intl Bonds (SPDR® Bloomberg Barclays International Corporate Bond ETF); Large Growth (iShares Russell 1000 Growth ETF); Large Value (iShares Russell 1000 Value ETF); Mid Growth (iShares Russell Mid-Cap Growth ETF); Mid Value (iShares Russell Mid-Cap Value ETF); Small Growth (iShares Russell 2000 Growth ETF); Small Value (iShares Russell 2000 Value ETF); Intl Equity (iShares MSCI EAFE ETF); Emg Markets (iShares MSCI Emerging Markets ETF); and Real Estate (iShares U.S. Real Estate ETF). The return displayed as “Allocation” is a weighted average of the ETF proxies shown as represented by: 30% U.S. Bonds, 5% International Bonds, 5% High Yield Bonds, 10% Large Growth, 10% Large Value, 4% Mid Growth, 4%Mid Value, 2% Small Growth, 2% Small Value, 31% International Stock, 7% Emerging Markets, 3% Real Estate.
Advisory products and services offered by Investment Adviser Representatives through Prime Capital Investment Advisors, LLC (“PCIA”), a federally registered investment adviser. PCIA: 6201 College Blvd., Suite#150, Overland Park, KS 66211. PCIA doing business as Prime Capital Wealth Management (“PCWM”) and Qualified Plan Advisors (“QPA”).
© 2022 Prime Capital Investment Advisors, 6201 College Blvd., Suite #150, Overland Park, KS 66211.