
The Bottom Line
● US Markets were finally able to post a positive week in some areas but are still deeply in the red year to date. International equities were still negative on the week and the year thus far.
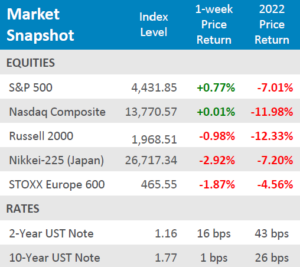
● Yields were volatile for the week, but the yield on the 2-Year US Treasury note settled +16bps and the yield on the 10-Year US Treasury note was only up +1bps for the week.
● Economic data for the week illustrated that the US economy grew at its fastest pace since the 1980s last year, but some concerning signs with consumer sentiment falling to its lowest level in a decade might give market participants pause for celebration.
Markets Rip Into the Weekend
Global equities seemed to pick up right where they left off with last week’s market action, spending the majority of the week in the red. Suddenly, during the final hours of trading on Friday afternoon, domestic markets quickly reversed their downward trend and shot upward. The S&P 500 finished the week in the green, up +0.77% for the week, but still down -7.01% for the year thus far. The technology heavy Nasdaq Composite was also able to post a positive week, up +0.1%for the week and still down a dismal -11.98% year to date. Small Cap equities, as measured by the Russell 2000, weren’t as fortunate as their larger peers. The Russell was down -0.98% for the week and -12.33% year to date. International equities couldn’t rally as much as domestic equities, European equities, as measured by the STOXX Europe 600 were down -1.87% for the week and -4.56% for the year so far. Japanese equites, as measured by the Nikkei-225, fell -2.92% for the week and are down -7.20% for the year thus far. Looking to the week ahead, market participants will be eagerly awaiting the employment data release set for Friday morning, as well as some higher frequency inflation metrics early in the week.
Digits & Did You Knows
MAYBE THIS YEAR? –Of the 8 NFL teams remaining in the playoffs as of Friday 1/21/2022, 3 football teams have never won a Super Bowl – the Buffalo Bills, the Tennessee Titans, and the Cincinnati Bengals. (source: NFL, BTN Research).
A MILLION LESS –In the fall of 2019 (pre-pandemic), 15.47 million undergraduates were enrolled in college. In the fall of 2021, 14.44 million undergraduates were enrolled. (source: Nat’l Student Clearinghouse Research Ctr. BTN Research)
WHAT IS A BUBBLE? –The US stock market was worth $53.4 trillion as of 12/31/2021, 2.3 times the size of our $23.2 trillion economy. At the peak of the “Dot-Com” stock bubble in March 2000, the US stock market was worth 1.4 times the size of the US Economy (source: Fund Manager Julien Bittel, BTN Research)
Click here to see the full review.
—
Source: Bloomberg. Asset-class performance is presented by using market returns from an exchange-traded fund (ETF) proxy that best represents its respective broad asset class. Returns shown are net of fund fees for and do not necessarily represent performance of specific mutual funds and/or exchange-traded funds recommended by the Prime Capital Investment Advisors. The performance of those funds may be substantially different than the performance of the broad asset classes and to proxy ETFs represented here. U.S. Bonds (iShares Core U.S. Aggregate Bond ETF); High-Yield Bond (iShares iBoxx $ High Yield Corporate Bond ETF); Intl Bonds (SPDR® Bloomberg Barclays International Corporate Bond ETF); Large Growth (iShares Russell 1000 Growth ETF); Large Value (iShares Russell 1000 Value ETF); Mid Growth (iShares Russell Mid-Cap Growth ETF); Mid Value (iShares Russell Mid-Cap Value ETF); Small Growth (iShares Russell 2000 Growth ETF); Small Value (iShares Russell 2000 Value ETF); Intl Equity (iShares MSCI EAFE ETF); Emg Markets (iShares MSCI Emerging Markets ETF); and Real Estate (iShares U.S. Real Estate ETF). The return displayed as “Allocation” is a weighted average of the ETF proxies shown as represented by: 30% U.S. Bonds, 5% International Bonds, 5% High Yield Bonds, 10% Large Growth, 10% Large Value, 4% Mid Growth, 4%Mid Value, 2% Small Growth, 2% Small Value, 31% International Stock, 7% Emerging Markets, 3% Real Estate.
Advisory products and services offered by Investment Adviser Representatives through Prime Capital Investment Advisors, LLC (“PCIA”), a federally registered investment adviser. PCIA: 6201 College Blvd., Suite#150, Overland Park, KS 66211. PCIA doing business as Prime Capital Wealth Management (“PCWM”) and Qualified Plan Advisors (“QPA”).
© 2022 Prime Capital Investment Advisors, 6201 College Blvd., Suite #150, Overland Park, KS 66211.