
Quick Takes
- Risk Assets Grind Higher. Risk assets continued their grind higher, adding to their already robust year-to-date gains.
- Inflation Continues to Soften. Inflation, as measured by the Fed’s preferred data point of Core PCE Deflator, showed even further signs of cooling off at the July reading with the data point landing below street estimates of +4.2% to +4.1% on the year-over-year metric. Despite this positive development, the FOMC elected to conduct yet another +25bps hike in interest rates during their July meeting.
- Dollar Falls Then Recovers. The greenback was in a downtrend for the first half of the month but began to trend upward as the FOMC’s meeting approached and then continued climbing after their decision to increase interest rates. Despite this recovery in the back half of the month, the dollar still closed below where it started the month.
- Robust Economic Production and Tight Labor Markets. The first estimate of second quarter GDP came in well above consensus estimates of +1.8%, landing at +2.4%. Labor Markets remain tight with the Unemployment Rate falling to 3.6% at the reading towards the beginning of the month.
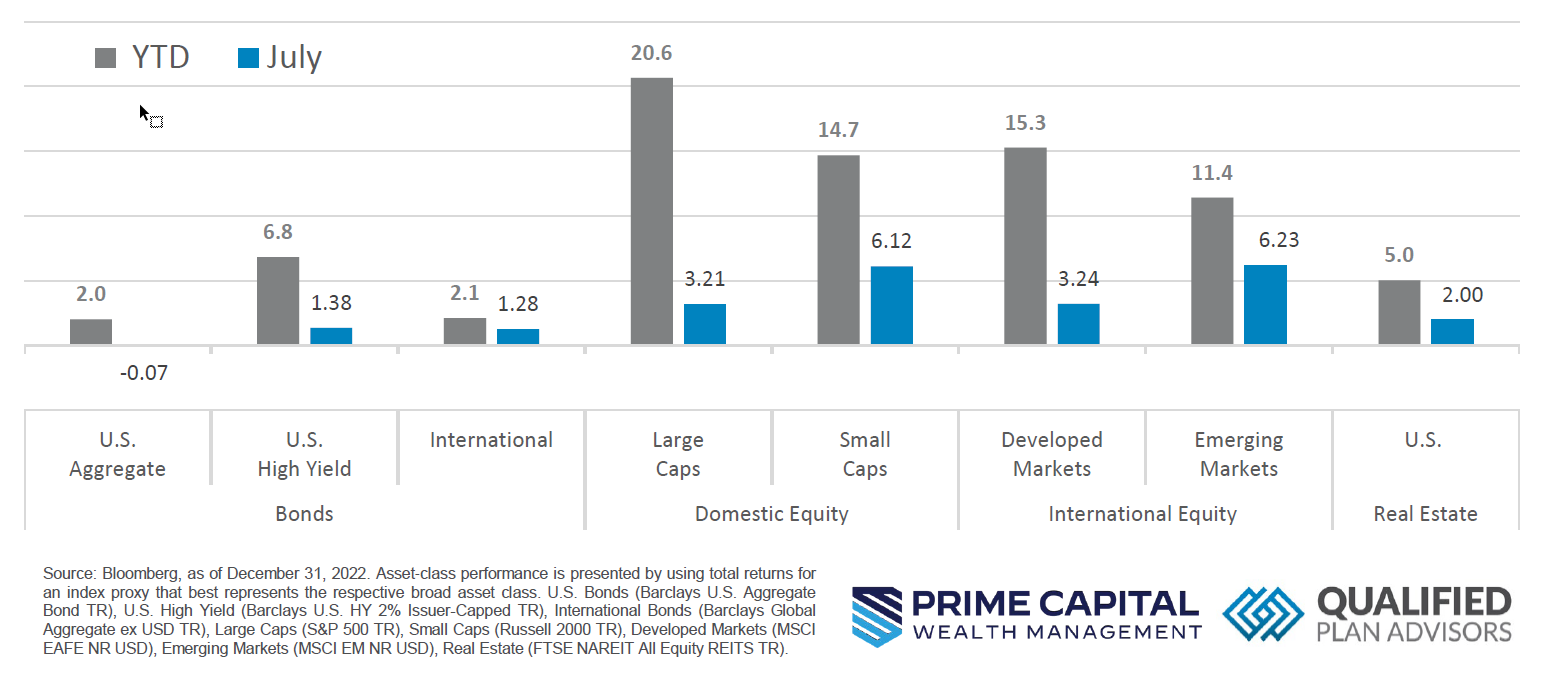
Asset Class Performance
July continued right where June left off with risk assets climbing higher and adding to their already stellar year-to-date return. At the end of the month, earnings season was in high gear with over half of S&P 500 companies having reported second quarter results. According to FactSet, 80% of companies have reported positive earnings per share so far.
Markets & Macroeconomics
As the effects of the Fed’s rapid tightening in financial conditions continue to work their way through the economic system, inflation, as measured by the Fed’s favored methodology of Personal Consumption Expenditure (“PCE”) index, continued to show signs of softening with the topline data reading landing in-line with street estimates of +3.0% and the Core metric (which excludes the volatile categories of food and energy) came in below survey estimates of +4.2%, landing at +4.1% on the year-over-year metrics. Despite the recent positive trend in inflation metrics over the course of the year so far, an area that has showed persistent tightness has been the labor markets. However, the July reading of the Employment Cost Index, which is a broad metric of the cost of wages and benefits, showed signs of softening for the second quarter with the reading landing below expectations of +1.1% coming in at +1.0%. Tight labor markets have plagued the Fed’s battle against inflation as the robust job markets have led to increased competition for available workers, which has led to increased upward pressure on wages and benefits. With consumers benefiting from these higher wages and benefits, this has allowed consumer spending to remain robust throughout the Fed’s tightening cycle. While consumers have increased pools to spend from, they are not immune to the effects of higher inflation, for the July reading of Real Personal Spending (i.e., inflation adjusted levels of Personal Spending) came in above expectations of +0.3%, landing at +0.4%, while Personal Income came in softer than expected at +0.3% versus estimates of +0.5%. This indicates that consumers ultimately spent more than they took in, likely tapping into dwindling levels of savings or credit card balances. This trend is not sustainable in the long-run, which would indicate that households will either need to cut back on spending or re-enter the labor market.
Bottom Line: Inflation, as measured by the PCE Core Deflator, continued to show signs of moderating as the effects of the Fed’s tightening of monetary policy work their way through the economic system. While Labor Markets have remained resiliently tight throughout the Fed’s campaign, market participants are continuing to see signs that softening is entering the jobs market with the Cost of Employment Index moderating in the second quarter. Furthermore, consumers appear to be increasing Personal Spending above levels of increasing Personal Income. While increased Personal Spending has helped prop up economic production, it’s not sustainable in the long-run which should lead to slackening in the Labor Markets as Participation increases.
©2023 Prime Capital Investment Advisors, LLC. The views and information contained herein are (1) for informational purposes only, (2) are not to be taken as a recommendation to buy or sell any investment, and (3) should not be construed or acted upon as individualized investment advice. The information contained herein was obtained from sources we believe to be reliable but is not guaranteed as to its accuracy or completeness. Investing involves risk. Investors should be prepared to bear loss, including total loss of principal. Diversification does not guarantee investment returns and does not eliminate the risk of loss. Past performance is no guarantee of comparable future results.
Source: Bloomberg. Asset‐class performance is presented by using market returns from an exchange‐traded fund (ETF) proxy that best represents its respective broad asset class. Returns shown are net of fund fees for and do not necessarily represent performance of specific mutual funds and/or exchange-traded funds recommended by the Prime Capital Investment Advisors. The performance of those funds June be substantially different than the performance of the broad asset classes and to proxy ETFs represented here. U.S. Bonds (iShares Core U.S. Aggregate Bond ETF); High‐Yield Bond (iShares iBoxx $ High Yield Corporate Bond ETF); Intl Bonds (SPDR® Bloomberg Barclays International Corporate Bond ETF); Large Growth (iShares Russell 1000 Growth ETF); Large Value (iShares Russell 1000 Value ETF); Mid Growth (iShares Russell Mid-Cap Growth ETF); Mid Value (iShares Russell Mid-Cap Value ETF); Small Growth (iShares Russell 2000 Growth ETF); Small Value (iShares Russell 2000 Value ETF); Intl Equity (iShares MSCI EAFE ETF); Emg Markets (iShares MSCI Emerging Markets ETF); and Real Estate (iShares U.S. Real Estate ETF). The return displayed as “Allocation” is a weighted average of the ETF proxies shown as represented by: 30% U.S. Bonds, 5% International Bonds, 5% High Yield Bonds, 10% Large Growth, 10% Large Value, 4% Mid Growth, 4% Mid Value, 2% Small Growth, 2% Small Value, 18% International Stock, 7% Emerging Markets, 3% Real Estate.
Advisory products and services offered by Investment Adviser Representatives through Prime Capital Investment Advisors, LLC (“PCIA”), a federally registered investment adviser. PCIA: 6201 College Blvd., Suite#150, Overland Park, KS 66211. PCIA doing business as Prime Capital Wealth Management (“PCWM”) and Qualified Plan Advisors (“QPA”). Securities offered by Registered Representatives through Private Client Services, Member FINRA/SIPC. PCIA and Private Client Services are separate entities and are not affiliated.
© 2023 Prime Capital Investment Advisors, 6201 College Blvd., Suite #150, Overland Park, KS 66211.