
Equities posted a second week of losses after the CDC announced the first omicron case and employment data disappointed.

Week-in-Review: Week ending in 11.26.21
Global risk assets tumbled for the week as the threat of a new covid-19 variant rises.

Week-in-Review: Week ending in 11.19.21
Domestic equities posted mixed results for the week after global case counts of the delta variant shot up, which dragged European equities off their recent record highs.

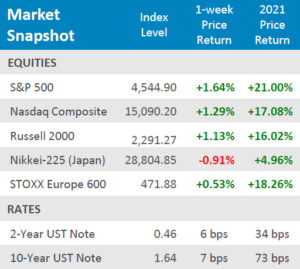
Week-in-Review: Week ending in 11.12.21
U.S. Equities faltered after inflation came in above expectations and jobless claims broke the recent trend coming in above expectations as well.

Qualified Plan Advisors: November Advocate Newsletter
As we enter the home stretch for 2021, plan sponsors are beginning to encounter the typical questions that arise near the end of each calendar year. This month’s newsletter is intended to help you to be prepared for those questions.

Week-in-Review: Week ending in 10.22.21
The Bottom Line
● U.S. equities continue their grind higher with the S&P 500 hitting fresh highs during the week. International equities were mixed for the week.
● Like equities, yields grinded higher, the 10-Year yield was up +7bps, and the 2-Year yield +6bps for the week.
● Economic news showed that supply chain constraints and labor shortages are still broadly affecting the economy with housing starts, building permits, and manufacturing activity retreating, but service activity has shown some signs of expanding.
New Highs Yet Again
The S&P 500 set a new intraday record on Thursday before retreating from its new high, which continued into the Friday session and took the Nasdaq with it. Despite the selling pressure at the end of the week, the Nasdaq rose +1.29% for the week and the S&P 500 was up +1.64%. Around 23% of the S&P 500 has reported earnings so far, most of whom have reported stellar results and added a tailwind to the index. Small caps weren’t terribly far behind the large caps, with the Russell 2000 up +1.13% for the week. International markets were more tepid as the Nikkei-225 fell -0.91% for the week, and European equities were somewhat muted as well, up +0.53% for the week. Fed Chairman Powell spoke on Friday, admitting that ongoing supply chain constraints could continue to add upward pressure on inflation, which may accelerate the Fed’s timeline for withdrawing economic support. Chairman Powell also made a comment that the timeline for tapering asset purchases before the end of the year is still intact, with next month likely being the starting point. Labor shortages and supply chain constraints seem to be the only thing holding back economic progress as covid-19 cases continue to decline as vaccination efforts continue to show progress.
Digits & Did You Knows
BOOM – The Nobel Prize for Economics has been awarded by the Royal Swedish Academy of Sciences since 1968. This year’s winners (3 Americans) will split the prize, worth approximately $1.2 million. Alfred Nobel created the annual prizes across multiple disciples at his death in 1896. Nobel made his fortune by inventing dynamite. (source: Nobelprize.org, BTN Research).
REDUCED NOT ELIMINATED – Social Security trustees announced on 8/31/21 that unless financial changes are implemented, the payment of Social Security benefits would drop to 76% of their originally promised levels beginning in 2033 through the year 2095. (source: Social Security Trustees 2021 Report, BTN Research).
Click here to see the full review.
—
Source: Bloomberg. Asset‐class performance is presented by using market returns from an exchange‐traded fund (ETF) proxy that best represents its respective broad asset class. Returns shown are net of fund fees for and do not necessarily represent performance of specific mutual funds and/or exchange‐traded funds recommended by the Prime Capital Investment Advisors. The performance of those funds may be substantially different than the performance of the broad asset classes and to proxy ETFs represented here. U.S. Bonds (iShares Core U.S. Aggregate Bond ETF); High‐YieldBond(iShares iBoxx $ High Yield Corporate Bond ETF); Intl Bonds (SPDR® Bloomberg Barclays International Corporate Bond ETF); Large Growth (iShares Russell 1000 Growth ETF); Large Value (iShares Russell 1000 ValueETF);MidGrowth(iSharesRussell Mid‐CapGrowthETF);MidValue (iSharesRussell Mid‐Cap Value ETF); Small Growth (iShares Russell 2000 Growth ETF); Small Value (iShares Russell 2000 Value ETF); Intl Equity (iShares MSCI EAFE ETF); Emg Markets (iShares MSCI Emerging Markets ETF); and Real Estate (iShares U.S. Real Estate ETF). The return displayed as “Allocation” is a weighted average of the ETF proxies shown as represented by: 30% U.S. Bonds, 5% International Bonds, 5% High Yield Bonds, 10% Large Growth, 10% Large Value, 4% Mid Growth, 4%Mid Value, 2% Small Growth, 2% Small Value, 18% International Stock, 7% Emerging Markets, 3% Real Estate.
Advisory services offered through Prime Capital Investment Advisors, LLC. (“PCIA”), a Registered Investment Adviser. PCIA doing business as Prime Capital Wealth Management (“PCWM”) and Qualified Plan Advisors (“QPA”).
© 2021 Prime Capital Investment Advisors, 6201 College Blvd., Suite #150, Overland Park, KS 66211.

Week-in-Review: Week ending in 10.15.21
Equities posted a strong week as earning announcements began to roll in. International equities outperformed U.S. equities, but all major indices were in the green.

Week-in-Review: Week ending in 10.08.21
Equities were able to claw back some of the losses from the previous weeks, but Small Caps and Japanese equities still fell further.

Q3 Quarterly Client Update
As we turn our calendars from the hot summer to temperate fall months, risk assets have started to cool with the weather, with volatility re-emerging in markets. Equities began the quarter by continuing their upward trend and breaking through record highs, driven by a dip in interest rates and robust corporate earnings reports.
Prime Capital Investment Advisors Recapitalizes as Adviser-Owned Partnership
Overland Park-based Prime Capital Investment Advisors recapitalized itself by offering an ownership stake to its financial advisers, adding 88 new partners on Friday.